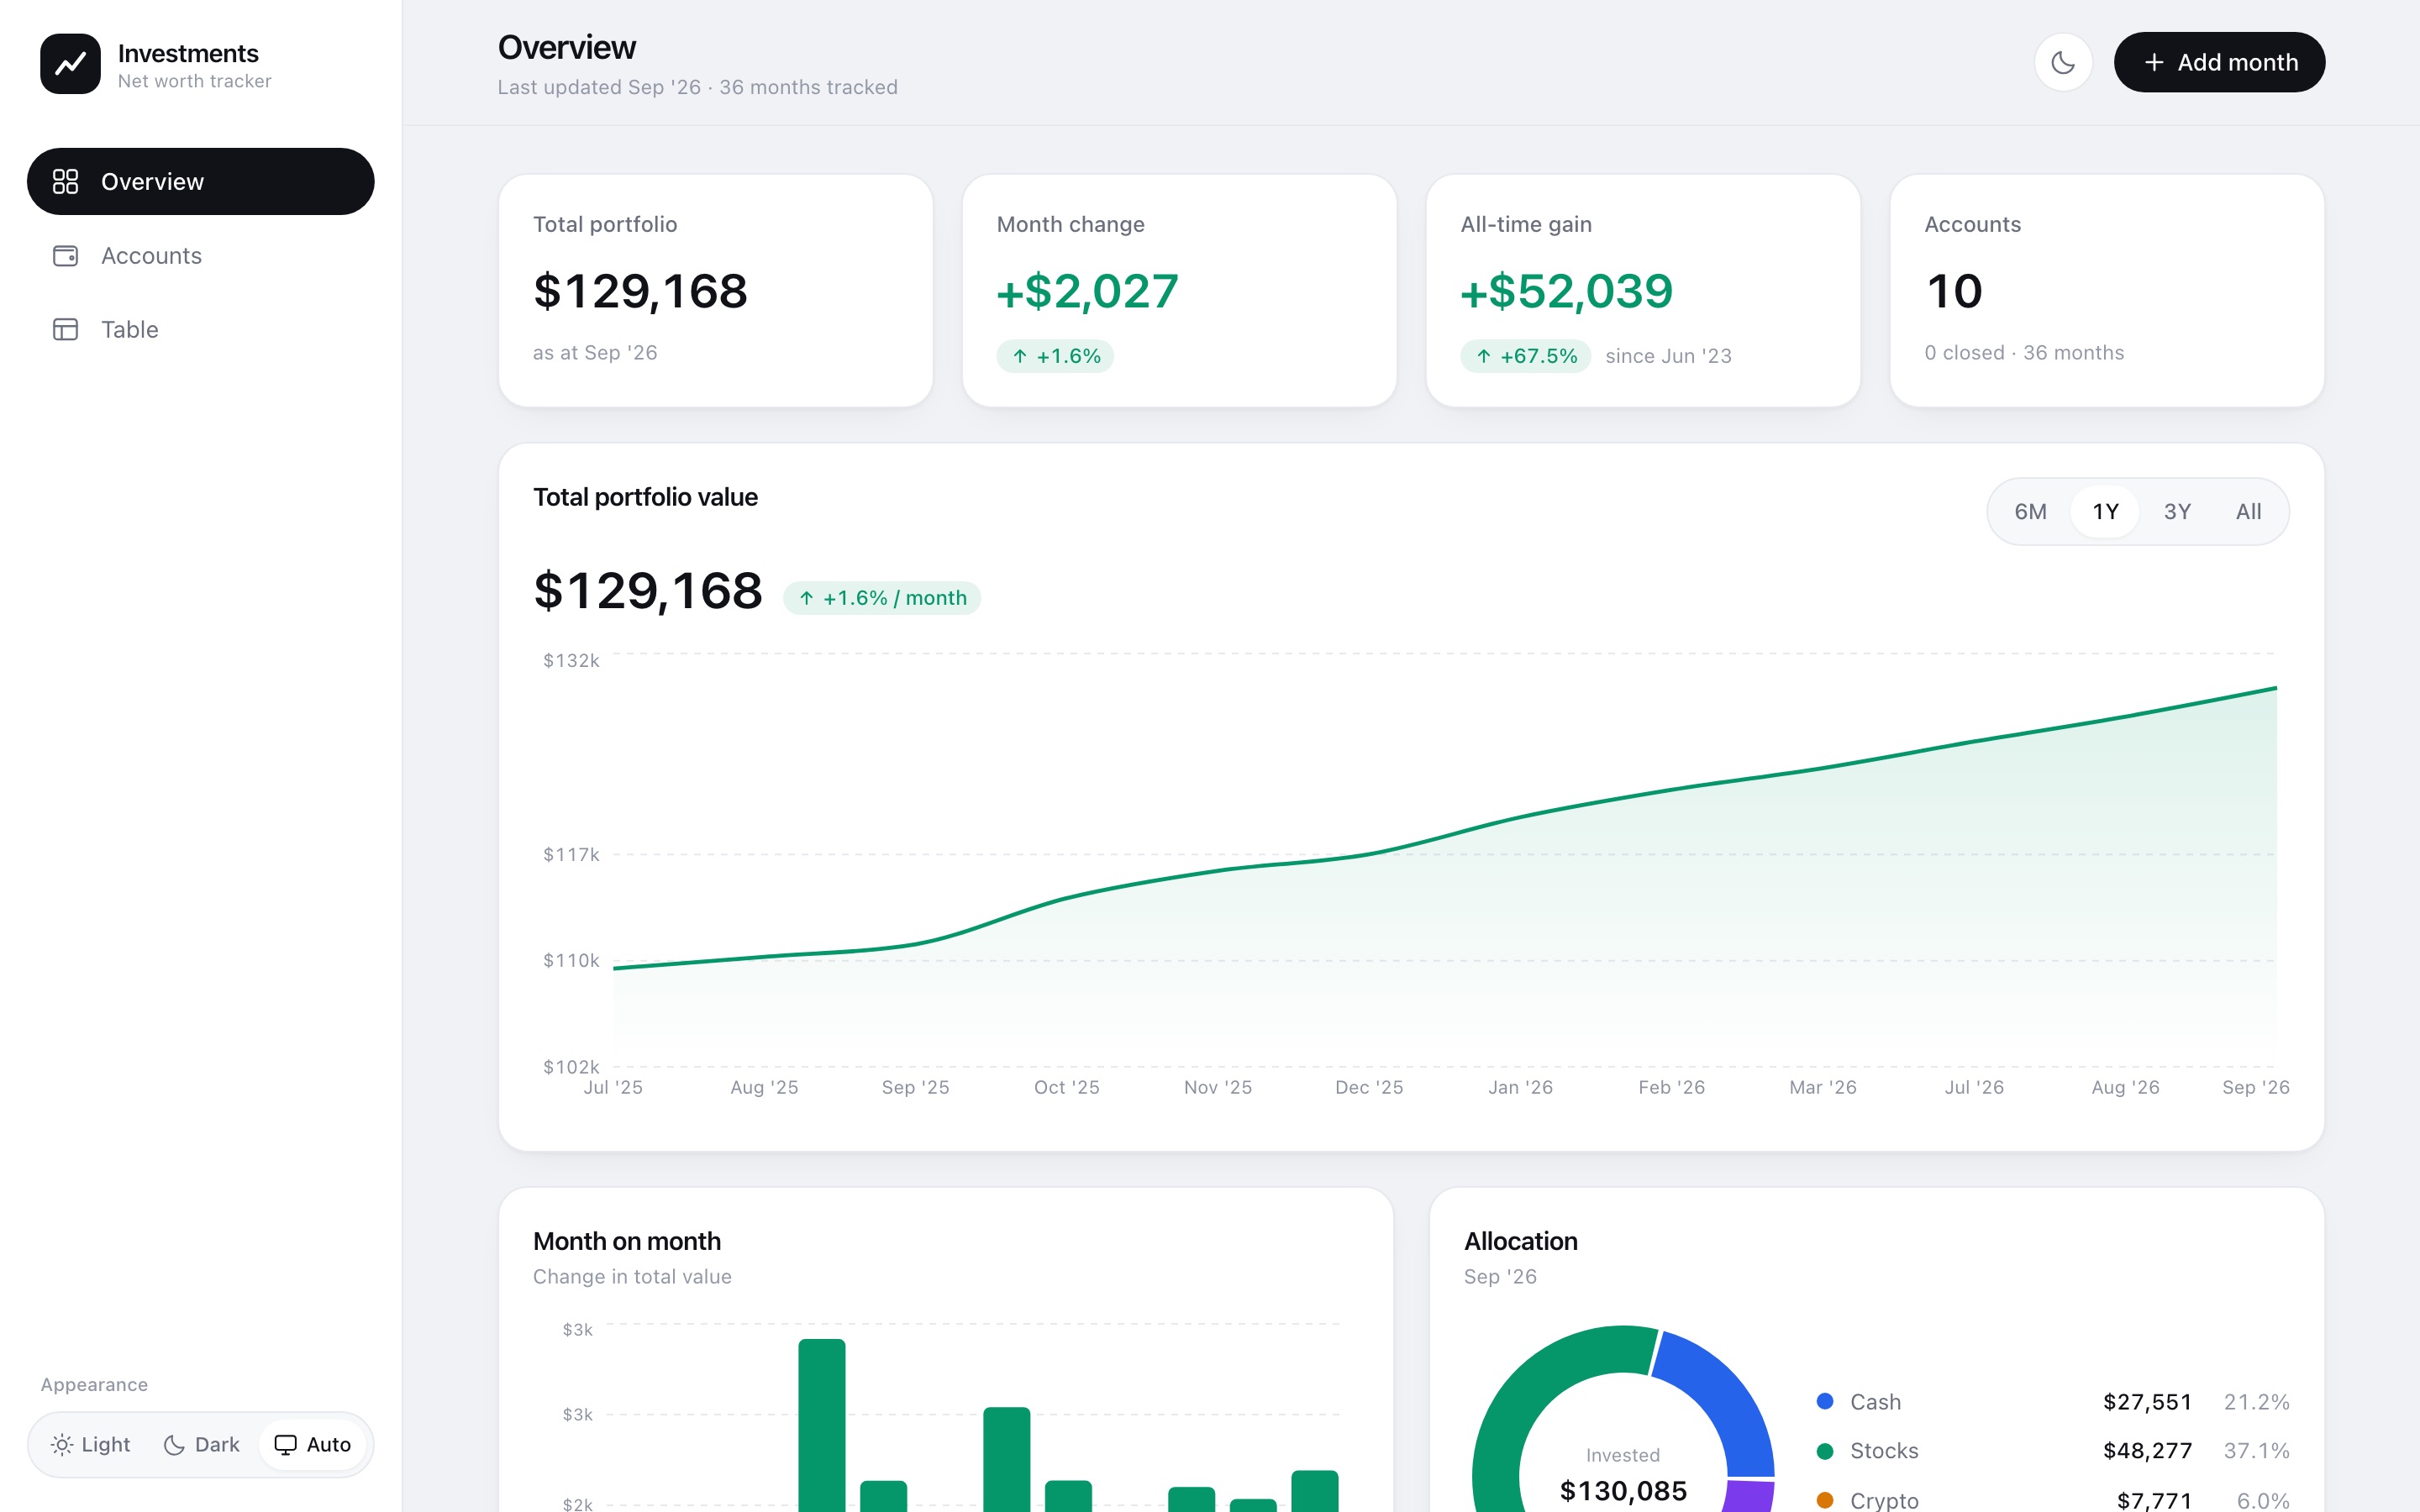
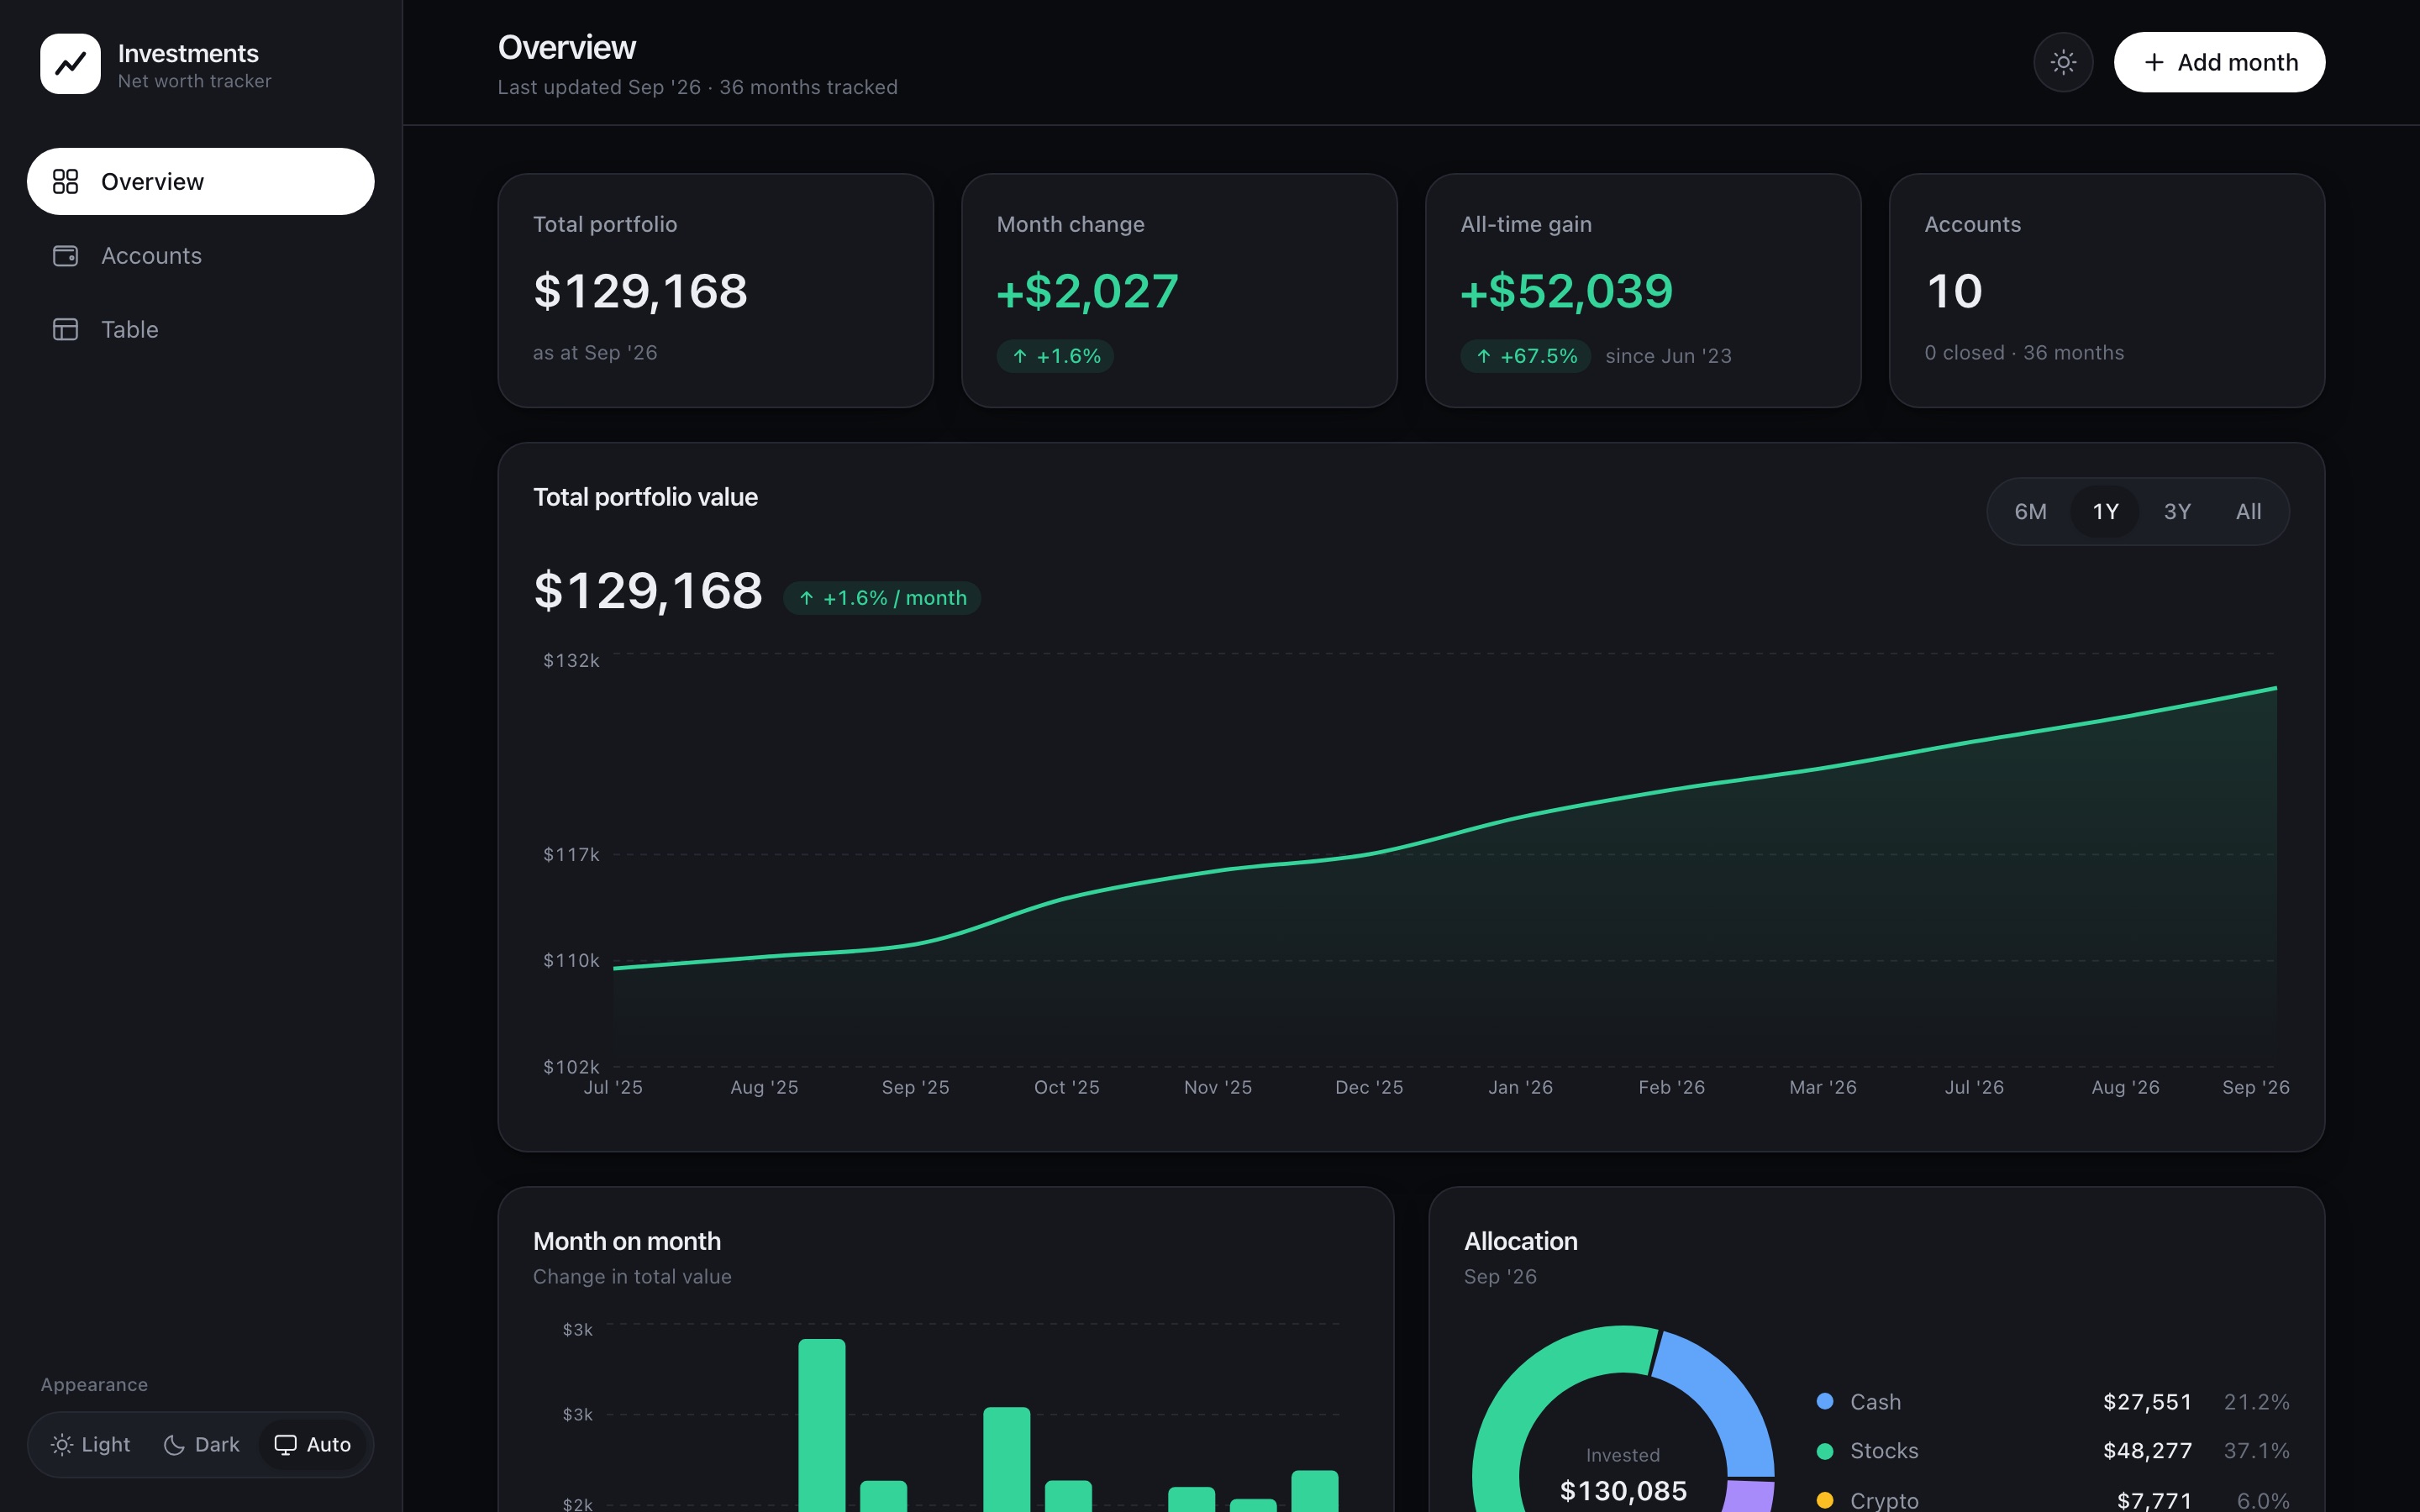
A dashboard I built to have a clear overview of my finances. It shows all my accounts month by month: how much I have, where it is and how it changed. It has light and dark themes from one set of tokens, it installs like an app and it works offline.
- Built
- Solo, with Claude Code
- Stack
- Next.js, Upstash Redis, Vercel
- Platform
- Web, installable (PWA)
- Year
- 2026
Decisions
01
I lost four months of data, so I made sure it can’t happen again
In August the database was removed, and four months of entries went with it because it was the only copy. Now every time something is saved, a backup goes into the repo, and an hourly job runs as a safety net. If a backup would make the history shorter, it doesn’t run. If the build fails, I know something is wrong.
02
Colours defined by their role
Every colour has a role, like canvas, surface, line, ink, positive and negative, and dark mode uses the same roles with different values. One attribute switches the whole app. Charts can’t read CSS variables, so they have their own pair of palettes that follow the same theme.
03
Remove the chart animation
The charts redraw every time you change tab or range. A 1.5-second animation every time felt slow rather than nice, so I removed it.
Screens